Torrance Real Estate Market Report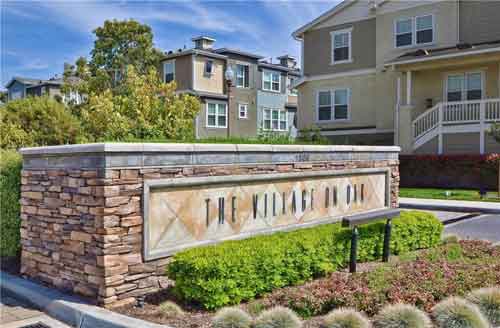
October 2025 at a glance
For the second straight month Torrance saw 96 homes close escrow. The average home price in Torrance for the month was $1,116,238.
Of the 96 homes that sold 7 were in the Old Torrance area highlighted in blue below. One of the sales was in the Park Plaza community on Plaza Del Amo and 2 of the sales were in The Village on Oak community.
Search the current homes for sale in Torrance
The average sold price was $1,116,238 which was down a bit from the very impressive $1,187,943 in September but slightly above August’s average home price of $1,110,152.
October Home Sales & Home Prices in Torrance CA
| Type | Address | Sale Price | Beds / Baths | Sq Feet | Year built | |
| CONDO | 22329 | Harbor Ridge | $705,000 | 3/3,0,0,0 | 1472 | 1979 |
| SFR | 22328 | Denker AVE | $741,000 | 5/2,0,0,0 | 2615 | 1902 |
| SFR | 1616 W | 227th ST | $780,000 | 3/2,0,0,0 | 891/ | 1952 |
| CONDO | 22310 | Spanish Oak CT | $815,000 | 4/1,2,1,0 | 1670 | 2023 |
| SFR | 20930 | Halale | $830,000 | 3/1,0,0,0 | 1286 | 1951 |
| SFR | 21011 | La Salle AVE | $1,080,000 | 4/2,0,0,0 | 1716 | 1951 |
| CONDO | 806 | Coriander DR #G | $440,000 | 2/2,0,0,0 | 829 | 1973 |
| TWNHS | 23234 | Sesame ST #G | $495,000 | 2/1,0,1,0 | 852/ | 1973 |
| CONDO | 23316 | Marigo AVE #R202 | $515,000 | 3/2,0,0,0 | 1066 | 1973 |
| CONDO | 941 W | Carson ST #210 | $555,000 | 2/2,0,0,0 | 1038 | 1982 |
| TWNHS | 852 W | 232nd ST | $690,000 | 3/2,0,0,0 | 1363 | 1974 |
| TWNHS | 869 | Coriander | $720,000 | 3/2,0,0,0 | 1228 | 1974 |
| SFR | 1102 | Maxfie | $799,000 | 3/2,0,0,0 | 1066 | 1959 |
| SFR | 22628 | Doble AVE | $799,900 | 3/1,0,0,0 | 1108 | 1954 |
| SFR | 22919 | Broadwell AVE | $830,000 | 4/2,0,0,0 | 1400 | 1953 |
| TWNHS | 22304 | Sage CT | $890,378 | 4/3,0,1,0 | 1610 | 2025 |
| SFR | 1215 W | 221st ST | $930,000 | 3/3,0,0,0 | 1329 | 1969 |
| SFR | 1113 W | Desford ST | $1,200,000 | 4/3,0,0,0 | 2120 | 1956 |
| CONDO | 24452 | Ward St | $960,000 | 3/1,1,0,0 | 1370 | 1981 |
| SFR | 24209 | Ward ST | $1,200,000 | 3/2,0,0,0 | 1894 | 1966 |
| SFR | 2642 | Loftyview | $1,205,000 | 3/1,1,0,0 | 1482 | 1955 |
| SFR | 2646 | Grand Summit RD | $1,360,000 | 3/1,2,0,0 | 1536 | 1954 |
| SFR | 25933 | Richville DR | $1,660,000 | 4/2,0,0,0 | 2333 | 1957 |
| CONDO | 3205 | Merrill #10 | $560,000 | 2/1,0,1,0 | 1450 | 1963 |
| CONDO | 3030 | Merrill DR #24 | $649,000 | 3/2,0,0,0 | 1243 | 1963 |
| TWNHS | 2931 | Plaza del Amo #121 | $805,000 | 2/3,0,0,0 | 1186 | 1985 |
| CONDO | 2971 | Plaza Del Amo #246 | $812,000 | 2/3,0,0,0 | 1186 | 1985 |
| TWNHS | 2577 | Plaza Del Amo #708 | $899,000 | 2/2,0,1,0 | 1526 | 1987 |
| TWNHS | 22477 | Kent AVE | $1,220,000 | 3/3,0,0,0 | 1897 | 1999 |
| SFR | 20912 | Avis AVE | $1,245,000 | 3/2,0,0,0 | 1514 | 1957 |
| SFR | 20533 | Eastwood AVE | $1,252,000 | 4/2,0,0,0 | 1816 | 1958 |
| SFR | 926 | Cerise AVE | $1,275,000 | 3/2,0,0,0 | 1329 | 1951 |
| SFR | 3432 | Garnet ST | $1,350,000 | 3/2,0,0,0 | 1311 | 1923 |
| SFR | 1122 | Cranbrook AVE | $1,675,000 | 6/3,0,1,0 | 2768 | 1951 |
| CONDO | 23065 | Nadine CIR #A | $530,000 | 2/1,0,1,0 | 950 | 1963 |
| CONDO | 22935 | Maple AVE #B | $615,000 | 1/1,1,0,0 | 1117 | 1963 |
| CONDO | 23061 | Nadine CIR #B | $628,000 | 2/2,0,0,0 | 1117 | 1963 |
| CONDO | 23027 | Nadine CIR #A | $675,500 | 2/2,0,0,0 | 1117 | 1963 |
| SFR | 22918 | Date AVE | $1,140,000 | 4/2,0,0,0 | 1609 | 1960 |
| SFR | 22317 | Madison ST | $1,359,000 | 4/2,0,0,0 | 1618 | 1956 |
| SFR | 3634 W | 226th ST | $1,675,000 | 4/2,0,1,0 | 3166 | 1953 |
| SFR | 22935 | Felbar AVE | $1,730,000 | 3/3,0,0,0 | 1991 | 1963 |
| SFR | 23326 | Elm AVE | $1,750,000 | 4/2,0,1,0 | 2625 | 1965 |
| SFR | 2805 W | 233rd Street | $2,251,650 | 4/3,0,0,0 | 2556 | 1965 |
| SFR | 4402 | Highgrove AVE | $1,230,000 | 3/2,0,0,0 | 1124 | 1953 |
| SFR | 5421 | Calle Mayor | $1,399,990 | 3/2,0,0,0 | 1470 | 1954 |
| SFR | 4201 | Mesa Street | $1,482,500 | 4/1,1,1,0 | 2340 | 1969 |
| SFR | 4609 | Paseo De Las Tortugas | $3,375,000 | 4/4,0,1,0 | 2740 | 1956 |
| SFR | 23401 | Anza Ave | $1,370,000 | 4/2,0,0,0 | 1571 | 1960 |
| SFR | 4652 | Juan AVE | $1,380,000 | 6/3,0,0,0 | 2520 | 1953 |
| SFR | 22430 | Susana AVE | $1,460,000 | 3/1,1,0,0 | 1084 | 1952 |
| SFR | 5209 | Milne DR | $1,515,000 | 3/2,0,0,0 | 1304 | 1952 |
| SFR | 22408 | Linda DR | $1,600,000 | 3/2,0,0,0 | 1876 | 1952 |
| SFR | 21405 | Mired Ave | $1,090,000 | 3/1,1,0,0 | 1144 | 1955 |
| SFR | 21706 | Talisman ST | $1,149,000 | 3/2,0,0,0 | 1140 | 1956 |
| SFR | 21917 | Palos Verdes Blvd | $1,200,000 | 3/1,1,0,0 | 1416 | 1955 |
| SFR | 21229 | Ocean AVE | $1,260,000 | 4/2,0,0,0 | 1263 | 1956 |
| SFR | 21901 | Marjorie AVE | $1,295,000 | 3/1,1,0,0 | 1528 | 1956 |
| SFR | 5112 W | Carson ST | $1,320,000 | 3/2,0,0,0 | 1211 | 1955 |
| SFR | 4202 | Carmen ST | $1,548,000 | 3/2,1,0,0 | 1845 | 1956 |
| SFR | 19432 | Anza AVE | $1,030,000 | 3/1,0,0,0 | 1112 | 1954 |
| SFR | 20549 | Victor ST | $1,175,000 | 3/2,0,0,0 | 1783 | 1961 |
| SFR | 4606 | Narrot St | $1,199,000 | 3/2,0,0,0 | 1240 | 1954 |
| SFR | 4819 | Halison ST | $1,375,000 | 3/2,0,0,0 | 1610 | 1955 |
| SFR | 19910 | Bernist AVE | $1,380,000 | 3/2,0,0,0 | 1112 | 1955 |
| SFR | 4906 | Garnet ST | $1,650,000 | 4/3,0,0,0 | 2415 | 1965 |
| SFR | 20421 | Tomlee AVE | $1,674,000 | 4/2,0,0,0 | 1793 | 1959 |
| SFR | 4547 | Narrot ST | $1,840,000 | 4/3,0,0,0 | 2550 | 1954 |
| CONDO | 16700 | Yukon Ave #218 | $585,000 | 2/1,1,0,0 | 859 | 1989 |
| SFR | 4014 W | 175th PL | $918,000 | 3/1,0,0,0 | 1098 | 1953 |
| SFR | 18028 | Faa AVE | $925,000 | 3/2,0,0,0 | 1228 | 1955 |
| SFR | 17511 | Delia AVE | $989,975 | 3/2,0,0,0 | 1229 | 1951 |
| SFR | 3133 W | 187th PL | $1,000,000 | 3/2,0,0,0 | 1365 | 1950 |
| SFR | 3717 W | 182nd ST | $1,020,000 | 3/2,0,0,0 | 1689 | 1953 |
| SFR | 18309 | Faysmith AVE | $1,075,000 | 3/2,0,0,0 | 1615 | 1956 |
| SFR | 3826 | 185th ST | $1,175,000 | 3/2,0,0,0 | 1455 | 1956 |
| SFR | 17820 | Florwood AVE | $1,230,000 | 4/3,0,0,0 | 1816 | 1954 |
| SFR | 17826 | Osage AVE | $1,382,000 | 3/3,0,0,0 | 2085 | 1985 |
| CONDO | 18409 | Van Ness | $645,000 | 3/1,1,1,0 | 1321 | 1964 |
| TWNHS | 2003 | Artesia BLVD #104 | $730,000 | 2/2,0,0,0 | 1207 | 1993 |
| SFR | 2034 W | 165th ST | $850,000 | 3/2,0,0,0 | 1088 | 1953 |
| SFR | 2213 W | 180th ST | $882,000 | 3/2,0,0,0 | 1356 | 1956 |
| SFR | 18301 | Purche AVE | $910,000 | 3/2,0,0,0 | 1356 | 1956 |
| SFR | 2321 W | 182nd ST | $935,000 | 3/2,0,0,0 | 1215 | 1956 |
| SFR | 17819 | Gramercy PL | $1,140,000 | 3/2,0,0,0 | 1250 | 1957 |
| SFR | 1614 | Crenshaw BLVD | $750,000 | 2/1,0,0,0 | 832 | 1929 |
| TWNHS | 1845 | Plaza Del Amo #C | $779,000 | 2/2,0,1,0 | 1122 | 1991 |
| TWNHS | 2160 | Plaza Del Amo #162 | $800,000 | 3/2,0,1,0 | 1578 | 1979 |
| SFR | 2415 | Cabrillo AVE | $840,000 | 2/1,0,0,0 | 854 | 1942 |
| TWNHS | 2303 | Jefferson ST #1208 | $1,195,000 | 3/3,0,0,0 | 2131 | 2010 |
| TWNHS | 2303 | Jefferson ST #1200 | $1,260,000 | 3/3,0,1,0 | 2250 | 2010 |
| SFR | 1004 | Arlington AVE | $1,350,000 | 4/3,0,0,0 | 2119 | 1917 |
| SFR | 23730 | Walter AVE | $1,218,000 | 3/2,0,0,0 | 1200 | 1956 |
| SFR | 23914 | Walnut ST | $1,350,000 | 3/1,2,1,0 | 2332 | 1964 |
| SFR | 2345 W | 232nd ST | $1,625,000 | 4/3,0,0,0 | 2138 | 1973 |
| MANL | 2550 | Pacific Coast #194 | $310,000 | 3/2,0,0,0 | 1624 | 2004 |
 on market home sales during April 2022 which was up from the 107 that sold in March.