December 2025 Home Sales and Home Prices in Torrance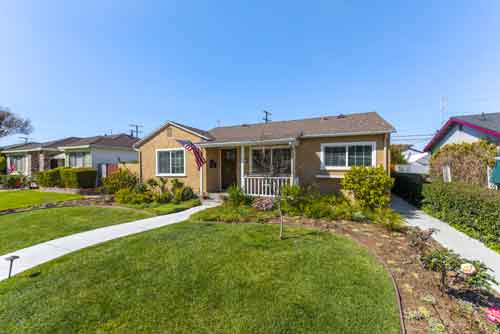
Welcome to the Torrance real estate market recap for this past month. December saw a slight slow down with 68 homes selling during the holiday month. The average home price in Torrance was $1,034,556 . That was the same number of home sales in November but well down from the 96 homes that closed escrow in both October and September.
4 of the homes that sold in December were in the Old Torrance area. (highlighted in bold blue below)
Search the current homes for sale in Torrance
The average “list” price of the homes that sold was $1,027,329 with the average sold price at $1,034,556 which was up slightly from $1,024,030 in November but a drop from$1,116,238 in October and even more from $1,187,943 in September.
The average dollar per square foot for the homes that sold was $696 which was similar to the $701 in November, and $733 in October. Days on market, or DOM, was a brief 40 days before going into escrow.
Torrance Home Sales & Prices for December 2025
| Home type | Address | Price | Beds & Baths | Sq Feet | Age | |
| TWNHS | 1514 W | 207th ST #C | $626,000 | 3/2,0,1,0 | 1633 | 2005 |
| SFR | 1654 W | 216th ST | $785,000 | 3/2,0,0,0 | 1061 | 1945 |
| SFR | 1567 W | 213th | $905,500 | 4/2,0,0,0 | 1365 | 1958 |
| SFR | 20907 | Halldale | $1,020,000 | 4/2,0,0,0 | 1586 | 1951 |
| CONDO | 1125 | Sepulveda BLVD #K103 | $428,000 | 1/1,0,0,0 | 618 | 1973 |
| SFR | 22832 | Menlo AVE | $460,000 | 2/1,0,0,0 | 675 | 1953 |
| CONDO | 23300 | Marigold AVE #z103 | $470,000 | 2/1,0,0,0 | 796 | 1973 |
| CONDO | 1229 W | 223rd ST #113 | $505,000 | 2/2,0,0,0 | 935 | 1987 |
| CONDO | 20553 S | Vermont AVE #1 | $530,000 | 2/0,2,0,0 | 968 | 1982 |
| TWNHS | 23311 | Sesame ST | $660,000 | 3/2,0,0,0 | 1363 | 1974 |
| CONDO | 22333 | Harbor Ridge LN #3 | $670,000 | 3/3,0,0,0 | 1549 | 1979 |
| SFR | 1106 W | 204th ST | $735,000 | 3/1,1,0,0 | 948 | 1951 |
| CONDO | 1291 | Bonnet WAY | $835,000 | 3/2,0,2,0 | 1704 | 2023 |
| SFR | 23033 | Alexandria | $855,000 | 5/3,0,0,0 | 1738 | 1956 |
| TPLX | 22607 S | Meyler ST | $1,588,500 | 5/3,2,0,0 | 3480 | 1997 |
| SFR | 24807 | Glencoe WAY | $1,350,000 | 4/2,0,0,0 | 1492 | 1950 |
| SFR | 25610 | Amber Leaf RD | $1,555,000 | 3/2,0,0,0 | 1692 | 1976 |
| SFR | 25908 | Matfield DR | $2,215,000 | 3/3,0,0,0 | 2390 | 1955 |
| CONDO | 3030 | Merrill DR #34 | $480,000 | 2/1,0,0,0 | 870 | 1963 |
| CONDO | 2367 | Jefferson #112 | $500,000 | 2/1,0,0,0 | 856 | 2008 |
| TWNHS | 2800 | Plaza Del Amo #415 | $770,000 | 2/2,0,1,0 | 1088 | 1987 |
| TWNHS | 20615 | Amie AVE #108 | $790,000 | 2/2,0,0,1 | 1120 | 2013 |
| TWNHS | 3101 | Plaza Del Amo #18 | $790,000 | 2/3,0,0,0 | 1184 | 1986 |
| SFR | 1322 | Kornblum AVE | $1,100,000 | 3/2,0,0,0 | 1260 | 1951 |
| SFR | 2512 | Lesserman | $1,150,000 | 3/2,0,0,0 | 1313 | 1951 |
| SFR | 20526 | Avis AVE | $1,215,000 | 4/1,2,0,0 | 1825 | 1958 |
| SFR | 908 | Fonthill AVE | $1,370,000 | 3/2,0,0,0 | 1374 | 1951 |
| SFR | 1630 | Fern AVE | $1,400,000 | 4/2,0,0,0 | 2320 | 1976 |
| SFR | 2889 | Plaza Del Amo #202 | $1,525,000 | 4/3,0,0,0 | 2806 | 2002 |
| CONDO | 22907 | Nadine CIR #B | $490,000 | 2/2,0,0,0 | 950 | 1963 |
| CONDO | 23028 | Nadine CIR #B | $540,000 | 2/2,0,0,0 | 1117 | 1963 |
| CONDO | 23033 | Maple AVE #A | $545,000 | 2/1,0,1,0 | 950 | 1964 |
| SFR | 22318 | Avis CT | $1,595,000 | 3/2,1,0,1 | 2234 | 1954 |
| SFR | 5109 | Paseo Del Pavon | $1,513,000 | 4/2,0,0,0 | 1597 | 1956 |
| SFR | 3837 | Paseo De Las Tortugas | $2,060,000 | 4/5,0,1,0 | 4510 | 1988 |
| SFR | 22319 | Linda | $1,270,000 | 3/1,1,0,0 | 1164 | 1952 |
| SFR | 22709 | Gaycrest AVE | $1,415,000 | 3/1,0,0,0 | 1064 | 1952 |
| SFR | 22721 | Marjorie AVE | $1,425,000 | 3/3,0,0,0 | 1907 | 1953 |
| SFR | 3914 W | 231st PL | $1,545,000 | 4/2,1,0,0 | 2330 | 1964 |
| SFR | 22516 | Marjorie | $1,620,000 | 3/1,1,0,0 | 1810 | 1953 |
| SFR | 5033 | Lee ST | $1,325,000 | 4/1,1,0,0 | 1376 | 1955 |
| SFR | 5029 | Cathann | $1,810,000 | 3/2,0,1,0 | 1659 | 1955 |
| CONDO | 21345 | Hawthorne | $657,500 | 2/2,0,0,0 | 910 | 2005 |
| SFR | 19917 | Ingrum WAY | $1,250,000 | 3/1,0,0,0 | 1115 | 1955 |
| SFR | 20614 | Mansel AVE | $1,299,000 | 3/2,0,0,0 | 1482 | 1958 |
| SFR | 4830 | Maricopa Street | $1,325,000 | 3/1,1,0,0 | 1545 | 1961 |
| SFR | 20034 | Grevillea AVE | $1,434,000 | 3/2,0,0,0 | 1785 | 1955 |
| SFR | 3838 W | 176th CT | $775,000 | 3/2,0,0,0 | 1968 | 1957 |
| SFR | 4223 | Artesia | $805,365 | 3/2,0,0,0 | 1166 | 1953 |
| SFR | 3151 W | 182nd ST | $835,000 | 2/1,0,0,0 | 1334 | 1952 |
| SFR | 16725 | Elgar AVE | $885,500 | 3/1,1,0,0 | 1328 | 1954 |
| SFR | 4101 W | 184th Street | $920,000 | 4/1,1,0,0 | 1204 | 1954 |
| SFR | 18405 | Delia Ave | $1,249,000 | 4/3,0,0,0 | 2041 | 1953 |
| SFR | 17234 | Ardath AVE | $750,000 | 2/1,0,0,0 | 844 | 1947 |
| SFR | 2306 W | 180th | $845,000 | 3/1,1,0,0 | 1364 | 1956 |
| SFR | 2135 W | 162nd | $875,000 | 4/2,0,0,0 | 1243 | 1952 |
| SFR | 1925 W | 186th | $899,000 | 3/2,0,0,0 | 1228 | 1960 |
| SFR | 2033 W | 181st | $905,000 | 4/2,0,0,0 | 1619 | 1961 |
| SFR | 17214 | Elgar | $945,000 | 3/2,0,0,0 | 1786 | 1948 |
| SFR | 1883 W | 182nd | $945,000 | 3/2,0,0,0 | 1640 | 1966 |
| TWNHS | 17508 | Van Ness AVE | $979,000 | 3/2,0,2,0 | 1776 | 2018 |
| SFR | 2605 W | 163rd ST | $1,050,000 | 3/2,0,0,0 | 1310 | 1956 |
| CONDO | 2742 | Cabrillo AVE #311 | $390,000 | 1/1,0,0,0 | 670 | 2006 |
| TWNHS | 2157 | Plaza Del Amo | $850,000 | 3/3,0,0,0 | 1212 | 2004 |
| TWNHS | 1800 | Oak ST #200 | $1,040,000 | 2/3,0,0,0 | 1960 | 2007 |
| SFR | 1424 | Post AVE | $1,250,000 | 4/3,0,0,0 | 1720 | 1941 |
| SFR | 2262 W | 239th | $1,365,425 | 5/3,0,0,0 | 2739 | 1980 |
| SFR | 2370 W | 235th PL | $1,390,000 | 5/2,1,0,0 | 2220 | 1963 |
The agent providing the information contained herein may not have been a buyer’s and/or seller’s agent. This report is based on data pulled from CRMLS on 1/17/26. The accuracy of all information is deemed reliable but not guaranteed and should be personally verified through personal inspection by and/or with the appropriate professionals.

 month.