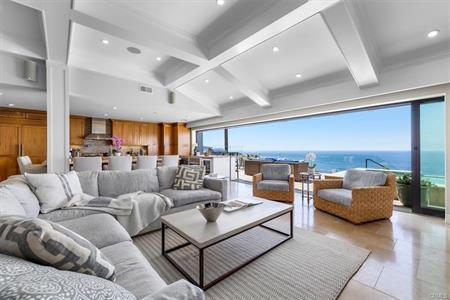
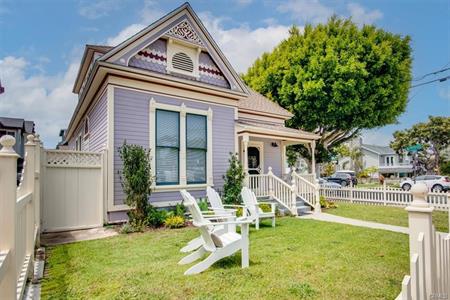
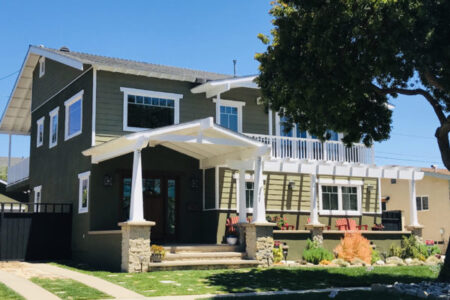
Take a look at the homes that sold in the neighborhood of Old Torrance during June of 2022. It was a busy month for home sales with 12 homes selling during the month. See how that compares with other months on our Old Torrance real estate trends and statistics page.
Search the current Old Torrance homes for sale
Old Torrance Home Sales In June
| Home Type | Address | Price | $ Per Foot | Bed/Bath | Sq Feet | Year Built | |
| CONDO/A | 1201 | Cabrillo AVE #110 | $313,000 | $559 | 1/1,0,0,0 | 560/A | 1993/PUB |
| CONDO/A | 2742 | Cabrillo #302 | $482,500 | $720 | 1/1,0,0,0 | 670/A | 2006/APP |
| CONDO/A | 1301 | Cabrillo AVE #410 | $530,000 | $875 | 1/1,0,0,0 | 606/A | 1993/ASR |
| CONDO/A | 3230 | Merrill DR #45 | $657,000 | $529 | 2/2,0,0,0 | 1243/A | 1964/ASR |
| SFR/D | 2802 | Olive ST | $890,000 | $808 | 2/1,0,0,0 | 1101/A | 1950/ASR |
| TWNHS/A | 1800 | Oak ST #328 | $908,000 | $683 | 2/2,0,1,0 | 1330/A | 2007/PUB |
| CONDO | 1747 | ARLINGTON AVE | $935,000 | $565 | 3/3,0,0,0 | 1655/ | 1990 |
| SFR/D | 1352 | Engracia AVE | $950,000 | $806 | 2/1,0,0,0 | 1178/A | 1940/ASR |
| TWNHS/A | 1800 | Oak ST #200 | $1,050,000 | $536 | 2/2,0,1,0 | 1960/A | 2007/ASR |
| TWNHS/A | 1800 | Oak ST #811 | $1,125,000 | $574 | 2/2,0,1,0 | 1960/A | 2007/ASR |
| SFR/D | 1452 | El Prado AVE | $1,335,798 | $644 | 2/1,1,1,0 | 2075/T | 1939/ASR |
| SFR/D | 1226 | Beech AVE | $1,800,000 | $633 | 6/3,0,0,0 | 2844/A | 1930/PUB |


 number of homes that sold as well as the prices that they sold for. There were 8 closed home sales during this past month.
 on market home sales during April 2022 which was up from the 107 that sold in March.