What a month it was for home sale in Torrance
April was another incredible month for both home sale volume as well as the prices that they sold for in Torrance CA. There were 129 on market home sales during April 2022 which was up from the 107 that sold in March.
The average “asking” price for the homes that sold during March was $970,531 with the average sold price an impressive $1,048,230. This meant that properties generally sold WELL above the list price.
The average price per foot for the month was $714. The average days on market was a very short 13 with the median days on market an amazing 8 before going into pending status. See how that compares with other months on our Torrance real estate trends and statistics page.
- Search the current homes for sale in only Old Torrance
- Search the current homes for sale in all of Torrance
Torrance Home Sales and Prices in April
| Type | Address | Price | $ Per Foot | Bed/Bath | Sq Feet | Year Built | |
| CONDO/A | 23230 | Sesame #10F | $485,000 | $576.01 | 2/1,0,1,0 | 842/A | 1973/ASR |
| CONDO | 1444 W | 227TH ST #18 | $490,000 | $507.25 | 2/1,0,1,0 | 966/ | 1982/ASR |
| TWNHS/A | 1611 W | 208th ST #3 | $650,000 | $349.46 | 3/2,0,1,0 | 1860/A | 2007/ASR |
| SFR/A | 1609 W | 228th ST | $745,000 | $482.51 | 4/3,0,0,0 | 1544/A | 1947/PUB |
| SFR/D | 1343 W | 222nd ST | $850,000 | $865.58 | 2/1,0,0,0 | 982/A | 1947/ASR |
| SFR/D | 20930 | Dalton AVE | $950,000 | $460.27 | 3/2,0,0,0 | 2064/A | 1951/ASR |
| SFR/D | 21119 | La Salle AVE | $951,000 | $514.33 | 3/3,0,0,0 | 1849/A | 1949/ASR |
| SFR/D | 20849 | Brighton AVE | $975,000 | $650.00 | 3/2,0,0,0 | 1500/A | 1956/ASR |
| CONDO/A | 21415 S | Vermont AVE #9 | $374,655 | $637.17 | 1/1,0,0,0 | 588/A | 1990/ASR |
| CONDO/A | 820 | Coriander DR #L | $385,000 | $602.50 | 1/1,0,0,0 | 639/A | 1973/ASR |
| CONDO/A | 20543 | S. Vermont Ave. #4 | $412,000 | $623.30 | 1/1,0,0,0 | 661/A | 1982/ASR |
| TWNHS/A | 817 W | 232nd ST #G | $450,000 | $528.17 | 2/1,0,1,0 | 852/A | 1973/ASR |
| CONDO/A | 23320 | Sesame ST #G | $485,000 | $585.04 | 2/1,1,0,0 | 829/A | 1973/ASR |
| CONDO/A | 1249 W | 223rd ST #107 | $505,000 | $540.11 | 2/2,0,0,0 | 935/A | 1987/ASR |
| CONDO/A | 20563 S | Vermont AVE #6 | $530,000 | $547.52 | 2/2,0,0,0 | 968/A | 1982/ASR |
| CONDO/A | 20426 S | Vermont AVE #80 | $530,000 | $546.96 | 2/2,0,0,0 | 969/A | 1978/ASR |
| CONDO/A | 22228 S | Vermont AVE #202C | $535,000 | $461.21 | 2/2,0,0,0 | 1160/A | 1986/ASR |
| CONDO/A | 20539 S | Vermont AVE #8 | $542,000 | $565.17 | 2/2,0,0,0 | 959/A | 1980/ASR |
| CONDO | 20505 S | Vermont AVE #6 | $553,000 | $576.64 | 2/2,0,0,0 | 959/A | 1980/ASR |
| CONDO/A | 835 | Coriander | $650,000 | $665.98 | 2/0,2,0,0 | 976/P | 1974/PUB |
| TWNHS/A | 1126 W | 228th ST #18 | $695,000 | $510.28 | 3/2,0,1,0 | 1362/A | 1988/ASR |
| SFR/D | 1118 | Maxfield ST | $830,000 | $628.31 | 3/1,1,0,0 | 1321/A | 1959/ASR |
| SFR/A | 20819 | New Hampshire AVE | $840,000 | $730.43 | 3/2,0,0,0 | 1150/A | 1960/ASR |
| SFR/D | 915 | Sorock DR | $865,000 | $631.85 | 4/1,0,0,0 | 1369/A | 1956/ASR |
| TWNHS | 23240 | Marigold AVE | $870,000 | $400.74 | 4/3,0,1,0 | 2171/ | 2021/BLD |
| TWNHS | 23244 | MarigoldAVE | $878,000 | $404.42 | 4/3,0,1,0 | 2171/ | 2021/BLD |
| TWNHS | 23230 | Marigold AVE | $893,000 | $411.33 | 4/3,0,1,0 | 2171/ | 2021/BLD |
| TWNHS | 23228 | Marigold AVE | $905,000 | 4/3,0,1,0 | / | 2022/BLD | |
| SFR/D | 1205 | Valle CT | $920,000 | $486.52 | 3/2,0,1,0 | 1891/A | 2005/ASR |
| CONDO/D | 1217 | Jasmine Walk | $925,000 | $479.52 | 4/2,0,1,0 | 1929/P | 2005/PUB |
| SFR/D | 25211 | Weston RD | $959,000 | $1,099.77 | 3/1,0,0,0 | 872/A | 1952/PUB |
| SFR/D | 3307 | Newton ST | $1,118,000 | $918.65 | 2/2,0,0,0 | 1217/A | 1950/ASR |
| SFR/D | 3341 | Cricklewood ST | $1,275,000 | $786.55 | 3/2,0,0,0 | 1621/AP | 1950/ASR |
| SFR | 2643 | Loftyview DR | $1,395,000 | $921.40 | 4/1,1,0,0 | 1514/ | 1954 |
| SFR/D | 2917 | Oakwood LN | $1,550,000 | $765.05 | 3/3,0,0,1 | 2026/A | 1976/ASR |
| SFR/D | 3638 | Blair WAY | $1,680,000 | $676.06 | 4/3,0,0,0 | 2485/A | 1976/ASR |
| CONDO/A | 3230 | Merrill DR #52 | $440,000 | $606.06 | 1/1,0,0,0 | 726/A | 1964/ASR |
| CONDO/A | 2559 | Plaza Del Amo #213 | $560,000 | $643.68 | 1/2,0,0,0 | 870/A | 1984/ASR |
| CONDO/A | 3230 | Merrill DR #67 | $655,000 | $530.79 | 2/2,0,0,0 | 1234/A | 1964/ASR |
| CONDO/A | 2605 | Sepulveda BLVD #122 | $675,000 | $566.75 | 2/2,0,0,0 | 1191/A | 2003/ASR |
| CONDO/A | 2567 | Plaza Del Amo #303 | $730,000 | $689.98 | 2/2,0,0,0 | 1058/A | 1985/ASR |
| CONDO/A | 2563 | Plaza Del Amo #204 | $775,000 | $732.51 | 2/2,0,0,0 | 1058/A | 1985/APP |
| TWNHS/A | 1712 | Elm AVE #19 | $815,000 | $511.29 | 2/2,1,0,0 | 1594/A | 1981/ASR |
| TWNHS/A | 2800 | Plaza Del Amo #94 | $815,000 | $640.22 | 2/2,0,1,0 | 1273/A | 1987/ASR |
| TWNHS/A | 2931 | Plaza Del Amo #80 | $870,000 | $733.56 | 2/3,0,0,0 | 1186/A | 1985/ASR |
| TWNHS/A | 2800 | Plaza Del Amo #361 | $880,000 | $742.62 | 2/2,0,1,0 | 1185/A | 1987/ASR |
| CONDO/A | 1704 | Elm Ave. #23 | $923,000 | $477.74 | 3/2,0,1,0 | 1932/A | 1981/ASR |
| TWNHS | 2300 | Maple AVE #101 | $990,000 | $577.93 | 3/3,0,0,0 | 1713/A | 1988/ASR |
| CONDO/A | 2300 | Maple AVE #98 | $1,010,000 | $589.61 | 3/3,0,0,0 | 1713/A | 1988/PUB |
| TWNHS/A | 3538 | Torrance BLVD #151 | $1,030,000 | $574.78 | 3/3,0,0,0 | 1792/A | 2005/PUB |
| TWNHS/A | 1615 | Crenshaw Blv | $1,050,000 | $728.66 | 2/2,0,1,0 | 1441/E | 2022/BLD |
| TWNHS/A | 2300 | Maple AVE #160 | $1,155,000 | $618.64 | 4/3,0,0,0 | 1867/A | 1987/ASR |
| SFR | 1755 S | Hickory AVE | $1,360,000 | $875.72 | 3/2,0,1,0 | 1553/A | 1954/ASR |
| SFR/D | 3432 | Garnet ST | $1,385,000 | $1,056.45 | 3/2,0,0,0 | 1311/A | 1923/ASR |
| SFR/D | 1216 | Teri AVE | $1,410,000 | $879.05 | 4/2,0,0,0 | 1604/A | 1951/ASR |
| CONDO/A | 22857 | Nadine CIR #B | $575,000 | $514.77 | 2/2,0,0,0 | 1117/A | 1963/ASR |
| CONDO/A | 22913 | Maple AVE #B | $580,888 | $520.04 | 2/2,0,0,0 | 1117/A | 1963/ASR |
| CONDO/A | 23010 | Nadine CIR #B | $642,000 | $574.75 | 2/1,1,0,0 | 1117/P | 1963/PUB |
| CONDO/A | 22646 | Nadine CIR | $762,000 | $802.11 | 2/1,0,1,0 | 950/A | 1963/ASR |
| SFR/D | 3623 W | 228th ST | $1,320,000 | $712.36 | 4/2,0,0,0 | 1853/A | 1964/ASR |
| SFR/D | 3426 W | 224th ST | $1,386,000 | $877.77 | 3/2,0,0,0 | 1579/A | 1954/ASR |
| SFR/D | 22526 | Eriel AVE | $1,390,000 | $716.86 | 4/2,0,0,0 | 1939/A | 1960/ASR |
| SFR/D | 2917 W | 229th ST | $1,430,000 | $638.96 | 4/3,0,0,0 | 2238/P | 1963/ASR |
| SFR/D | 3706 W | 227th ST | $1,502,000 | $731.26 | 4/3,0,0,0 | 2054/A | 1954/ASR |
| SFR/D | 4932 | Newton ST | $1,483,000 | $755.86 | 4/4,0,1,0 | 1962/A | 1954/ASR |
| SFR/D | 4141 | Mesa ST | $1,750,000 | $609.97 | 4/3,0,0,0 | 2869/A | 1978/ASR |
| SFR/D | 4439 | Newton ST | $1,910,000 | $1,032.43 | 3/2,0,1,0 | 1850/S | 1954/ASR |
| SFR/D | 4327 | Vista Largo | $1,920,000 | $924.86 | 4/2,0,1,0 | 2076/A | 1965/ASR |
| SFR/D | 5422 | Riviera WAY | $2,110,000 | $922.61 | 5/2,0,0,0 | 2287/A | 1954/PUB |
| CONDO/A | 23930 | Los Codona AVE #209 | $480,000 | $696.66 | 1/1,0,0,0 | 689/A | 1970/ASR |
| SFR/D | 22228 | Warmside AVE | $1,200,000 | $1,395.35 | 3/1,0,0,0 | 860/A | 1952/ASR |
| SFR/D | 22319 | Kathryn AVE | $1,205,000 | $1,115.74 | 3/1,0,0,0 | 1080/A | 1953/ASR |
| SFR/D | 22415 | Ladeene AVE | $1,250,000 | $1,157.41 | 3/1,1,0,0 | 1080/A | 1953/ASR |
| SFR/D | 22629 | Linda DR | $1,395,000 | $1,311.09 | 3/1,0,0,0 | 1064/A | 1952/ASR |
| SFR/D | 22409 | Ladeene AVE | $1,530,000 | $625.26 | 5/3,0,0,0 | 2447/A | 1953/ASR |
| SFR/D | 23316 | Audrey AVE | $1,640,000 | $598.54 | 4/2,0,1,0 | 2740/A | 1966/PUB |
| SFR/D | 23228 | Los Codona AVE | $1,915,000 | $701.47 | 5/3,0,0,0 | 2730/A | 1966/ASR |
| SFR/D | 23011 | Doris WAY | $3,055,058 | $753.41 | 4/5,0,0,0 | 4055/A | 1992/ASR |
| SFR/D | 21733 | Marjorie AVE | $1,119,000 | $962.99 | 3/1,1,0,0 | 1162/A | 1956/ASR |
| SFR/D | 22113 | Redbeam AVE | $1,332,000 | $798.56 | 3/2,0,0,0 | 1668/A | 1955/ASR |
| SFR/D | 22010 | Marjorie AVE | $1,450,000 | $1,271.93 | 3/1,1,0,0 | 1140/A | 1956/ASR |
| SFR/D | 4903 | Lee ST | $1,500,000 | $1,077.59 | 3/1,1,0,0 | 1392/A | 1955/ASR |
| SFR/D | 21918 | Ocean AVE | $1,508,000 | $921.20 | 3/2,0,0,0 | 1637/A | 1956/ASR |
| SFR/D | 21617 | Evalyn AVE | $1,700,000 | $812.62 | 3/2,1,0,0 | 2092/A | 1955/ASR |
| TWNHS | 4268 | Spencer ST | $1,050,000 | $479.89 | 2/3,0,0,0 | 2188/ | 1989 |
| SFR/D | 19401 | Entradero AVE | $1,160,000 | $1,035.71 | 3/1,0,0,0 | 1120/A | 1955/ASR |
| SFR/D | 4559 | Narrot ST | $1,275,000 | $1,146.58 | 3/1,0,0,0 | 1112/A | 1954/PUB |
| SFR | 19219 | Beckworth AVE | $1,300,000 | $1,062.09 | 3/1,1,0,0 | 1224/ | 1954 |
| SFR/D | 4707 | Konya DR | $1,310,000 | $939.07 | 3/2,0,0,0 | 1395/A | 1960/ASR |
| SFR/D | 5018 | Deelane ST | $1,399,000 | $1,258.09 | 3/1,1,0,0 | 1112/A | 1955/PUB |
| SFR/D | 19904 | Saltee AVE | $1,550,000 | $911.23 | 3/1,1,0,0 | 1701/T | 1955/ASR |
| SFR/D | 4753 | Deelane ST | $1,580,000 | $891.65 | 4/3,0,0,0 | 1772/A | 1954/ASR |
| SFR/D | 5503 | Konya DR | $1,736,275 | $875.14 | 5/2,1,0,0 | 1984/A | 1959/ASR |
| SFR/D | 21046 | Tomlee AVE | $1,900,000 | $715.36 | 3/3,0,0,0 | 2656/A | 1991/ASR |
| TWNHS/A | 4325 W | 182nd ST #10 | $760,000 | $543.63 | 2/2,0,1,0 | 1398/E | 1980/PUB |
| SFR/D | 18422 | Falda ave | $810,000 | $741.08 | 3/1,0,0,0 | 1093/A | 1953/ASR |
| TWNHS/A | 4021 W | 182nd ST #H | $825,000 | $487.88 | 3/3,0,0,0 | 1691/A | 1989/ASR |
| SFR/D | 18824 | Patronella AVE | $988,000 | $835.16 | 3/1,0,1,0 | 1183/A | 1954/ASR |
| SFR/D | 18333 | Faysmith AVE | $1,007,086 | $866.68 | 3/2,0,0,0 | 1162/A | 1956/ASR |
| SFR/D | 4121 W | 180th ST | $1,020,000 | $782.81 | 4/2,0,0,0 | 1303/A | 1955/ASR |
| SFR/D | 16720 | Falda AVE | $1,160,000 | $774.37 | 3/2,0,1,0 | 1498/A | 1952/ASR |
| TWNHS/D | 1819 | W 182nd St #A | $750,000 | $438.08 | 3/2,0,1,0 | 1712/A | 1985/ASR |
| SFR/D | 2065 W | 160th ST | $820,000 | $687.92 | 2/1,0,0,0 | 1192/A | 1950/ASR |
| SFR/D | 16228 | Daphne AVE | $883,000 | $684.50 | 3/1,1,0,0 | 1290/A | 1956/ASR |
| SFR/D | 17310 | Wilton PL | $905,000 | $788.33 | 3/1,1,0,0 | 1148/A | 1954/ASR |
| SFR/D | 17210 | Illinois CT | $925,000 | $886.02 | 3/1,0,0,0 | 1044/A | 1954/PUB |
| SFR/D | 2510 W | 180th ST | $1,100,000 | $646.68 | 4/3,0,0,0 | 1701/A | 1956/ASR |
| SFR/D | 2054 W | 160th ST | $1,124,000 | $909.39 | 3/2,0,0,0 | 1236/D | 1950/ASR |
| SFR/D | 2611 W | 180th ST | $1,189,000 | $634.47 | 4/1,1,1,0 | 1874/A | 1956/ASR |
| SFR/D | 2024 W | 159th ST | $1,200,000 | $708.38 | 4/2,0,1,0 | 1694/A | 1950/ASR |
| CONDO/A | 1201 | Cabrillo AVE #308 | $325,000 | $580.36 | 1/1,0,0,0 | 560/A | 1993/ASR |
| CONDO | 1281 | Cabrillo AVE #102 | $425,000 | $701.32 | 1/1,0,0,0 | 606/ | 1993 |
| CONDO/A | 2742 | Cabrillo AVE #102 | $425,000 | $634.33 | 1/1,0,0,0 | 670/A | 2006/ASR |
| TWNHS | 1324 | El Prado AVE #36 | $950,000 | $682.47 | 3/3,0,0,0 | 1392/ | 1997 |
| SFR/D | 1926 | Arlington AVE | $950,000 | $863.64 | 3/1,0,0,0 | 1100/A | 1919/ASR |
| TWNHS/A | 2303 | Jefferson ST #1102 | $1,000,000 | $505.05 | 3/3,0,0,0 | 1980/A | 2010/ASR |
| SFR/D | 2419 | Cabrillo AVE | $1,135,000 | $955.39 | 2/1,1,0,0 | 1188/A | 1942/ASR |
| SFR/D | 1427 | Post AVE | $1,300,000 | $635.08 | 4/2,0,0,0 | 2047/S | 1926/ASR |
| TWNHS/A | 22746 | Cypress ST | $845,000 | $614.99 | 3/3,0,0,0 | 1374/A | 1974/ASR |
| SFR/D | 2150 W | 235th PL | $875,000 | $653.96 | 3/3,0,0,0 | 1338/A | 1979/ASR |
| SFR/D | 2424 W | 239th ST | $1,150,000 | $701.65 | 3/2,0,0,0 | 1639/A | 1956/PUB |
| SFR/D | 1947 W | 235th PL | $1,150,000 | $611.38 | 4/2,0,0,0 | 1881/A | 1963/ASR |
| SFR/D | 1843 W | 244th ST | $1,230,000 | $594.78 | 3/1,1,0,0 | 2068/A | 1964/ASR |
| SFR/D | 2422 W | 230th ST | $1,237,694 | $708.06 | 3/2,0,0,0 | 1748/A | 1962/PUB |
| SFR/D | 2142 W | 233rd ST | $1,375,000 | $644.03 | 3/3,0,0,0 | 2135/A | 1969/ASR |
| SFR/D | 2437 W | 235th ST | $1,408,000 | $592.59 | 4/1,2,0,0 | 2376/A | 1973/ASR |
| SFR/D | 2054 | Kathy WAY | $1,501,000 | $547.61 | 4/4,0,0,0 | 2741/A | 1947/ASR |
| CONDO/A | 941 | W Carson #113 | $395,000 | $567.53 | 1/1,0,0,0 | 696/A | 1982/ASR |
| TWNHS/A | 22804 S | Van Deene AVE | $605,000 | $533.04 | 2/2,0,1,0 | 1135/A | 1978/ASR |


 townhomes and condos selling in this historic part of Torrance. The average list price for the year was$5751,000 with the average sold price being $769,000 meaning that in general homes sold well over what they were listed for. It was definitely a “seller’s market”. Homes averaged only 17 days on the market before going into escrow.
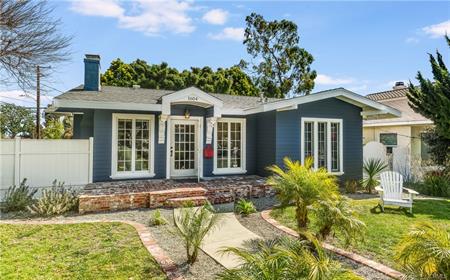
 bedrooms and 2 baths with just under 1,400 square feet. The home was in fairly original condition but certainly well maintained. Sitting on a 6,600+ foot lot the home had some very nice outdoor areas. Listed at $825,000, 2720 Martha sold way over at a price of $905,000 after only a few days on the market.