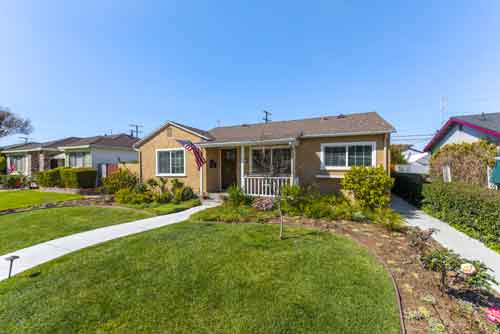
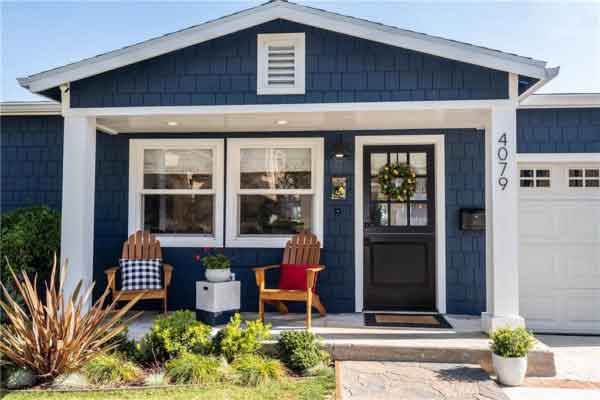
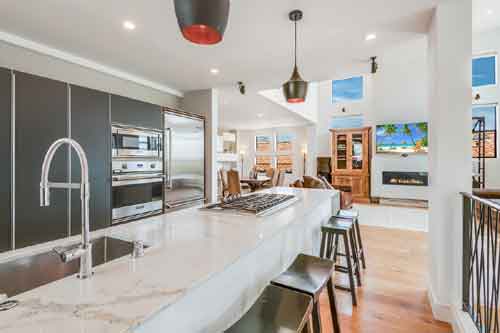
Take a look below at the homes that sold in the Old Torrance area of Torrance CA. There were 7 home sales during the month of which most were townhomes. The average list price of the homes that sold was $664,429 with the average sold price being just over $682,000. Homes averaged only 19 days on the market before going into escrow.
Old Torrance November Home Sales and Prices
| Type | Address | Price | $ Per Foot | Bed/Bath | Sq Feet | Year | Sold Date | |
| CONDO/A | 1301 | Cabrillo AVE #112 | $475,000 | $710.01 | 2/1,0,0,0 | 669/A | 1993/ASR | 11/12/2021 |
| SFR/D | 716 | Pacific LN | $500,000 | $757.58 | 1/2,0,0,0 | 660/A | 1918/ASR | 11/17/2021 |
| CONDO/A | 2742 | Cabrillo AVE #101 | $550,000 | $528.85 | 2/1,1,0,0 | 1040/A | 2006/ASR | 11/19/2021 |
| TWNHS/A | 2603 | Apple AVE #109 | $685,000 | $643.80 | 2/1,0,1,0 | 1064/A | 1984/ASR | 11/2/2021 |
| TWNHS | 813 | Van Ness AVE #A | $830,000 | $590.33 | 3/2,0,1,0 | 1406/A | 2000/ASR | 11/30/2021 |
| TWNHS/A | 1524 | Cravens AVE #19 | $830,000 | $596.26 | 3/2,0,1,0 | 1392/A | 1996/PUB | 11/19/2021 |
| SFR/D | 2720 | Martha AVE | $905,000 | $655.80 | 3/2,0,0,0 | 1380/A | 1949/EST | 11/30/2021 |
 reasons although it still may not be the best fit for you. Everyone is different but in terms of long term planning it’s almost always better to own than rent.

